GraphTSNE
16 Apr 2019 |
|---|
| GraphTSNE on the Cora Citation Network |
In recent years, interest in graph-structured data has surged, following the success of graph convolutional networks and graph representation learning. Because of this, it is increasingly important for researchers and practitioners alike to gain human insight into such datasets by means of visualization. In this post, we will discuss GraphTSNE: a novel visualization technique for graph-structured data.
What is graph-structured data?
Graph-structured data consists of datasets with two sources of information: graph connectivity between nodes and data features on nodes. In other words, they comprise data features lying within an explicit graph structure. Real-world examples of such datasets are abundant. Just think social networks, functional brain networks and gene-regulatory networks, among many others.
Why visualization?
In contrast to the more general problem of dimensionality reduction, visualizations can be particularly useful as a tool to explore and hypothesize about given data. By placing high-dimensional data in a low-dimensional map (in 2D or 3D), such visualizations can often reveal interesting structure within the data that would otherwise be inscrutable.
Two approaches to visualization. Is there a middle ground?
In the literature on dimensionality reduction, we may consider two general approaches to visualizing graph-structured data. First, we can construct a visualization based on the feature similarity between nodes using the highly successful technique of t-SNE (van der Maaten & Hinton, 2008). Second, we can visualize the graph structure directly with a standard graph visualization technique like Laplacian Eigenmaps (Belkin & Niyogi, 2001).
Roughly speaking, the common objective in visualization is to obtain a low-dimensional representation that maximally preserves the local structure of the original data, which could be in terms of pairwise feature distances and/or graph distances. However, both approaches are unsatisfactory because they cannot incorporate information from both node features and graph structure. This is why we have designed GraphTSNE to fill this gap.
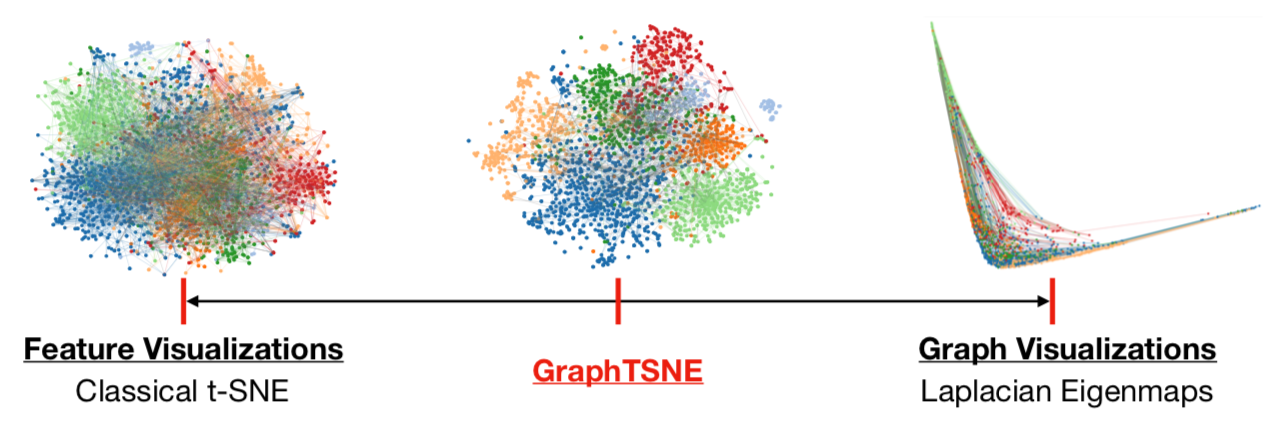 |
|---|
| GraphTSNE produces visualizations which account for both node features and graph structure. |
Method
GraphTSNE relies on two modifications to a parametric version of t-SNE proposed by van der Maaten (2009). First, we use a graph convolutional network (GCN) (Sukhbaatar et al., 2016; Kipf & Welling, 2016; Hamilton et al., 2017) as the parametric model for the non-linear mapping between the high-dimensional data space and the low-dimensional embedding space, i.e. . By stacking multiple graph convolutional layers, GCNs learn node representations by aggregating information from distant neighbors in the graph. In particular, our present work uses a two-layer residual gated GCN of Bresson & Laurent (2018).
Second, we train our GCN using a modified t-SNE loss composed of two sub-losses: a graph clustering loss and a feature clustering loss . These sub-losses derive directly from the classical t-SNE loss, except that we supply the loss function with two different distance metrics. The graph clustering loss takes as input the pairwise shortest-path (geodesic) distances between nodes, i.e. . Whereas, the feature clustering loss takes as input a suitable distance measure between node features, e.g. the squared Euclidean distance between two high-dimensional vectors, i.e. . Lastly, we can explore the tradeoff between the two sub-losses by taking a weighted combination: .
A Case Study on Cora
Let’s consider a concrete benchmark dataset called the Cora citation network. In this network, each node is a document represented by a word-occurrence feature vector and a class label. Furthermore, each document lies within a network, where every edge between two documents represents a citation link. Intuitively, natural clusters in the network (i.e. papers with the same document class) tend to share similar features and/or belong to the same graph community.
To understand the different contributions of the graph structure and node features, we can vary the extent of graph clustering with the hyperparameter in our composite loss. At , our method reverts to pure feature clustering as in classical t-SNE. Whereas, at , our method performs pure graph clustering, similar to tsNET (Kruiger et al., 2017). Unlike spectral methods like Laplacian Eigenmaps, tsNET is more closely related to a popular class of graph layout algorithms called force-directed graph drawing (Fruchterman & Reingold, 1991). In our paper, we propose a reasonable way (though certainly not the only way) of determining a desirable value for based on visualization distance metrics.
By incorporating both graph connectivity and node features, the visualizations produced with intermediate values of achieve better separation between classes and therefore, higher 1-NN generalization accuracy. This phenomenon has been well-studied in the context of semi-supervised classification (Yang et al., 2016; Kipf & Welling, 2016; Velickovic et al., 2018) and unsupervised representation learning (Hamilton et al., 2017; Velickovic et al., 2019). At the proposed value of , we demonstrate both quantitatively and qualitatively that GraphTSNE outperforms existing visualization techniques.
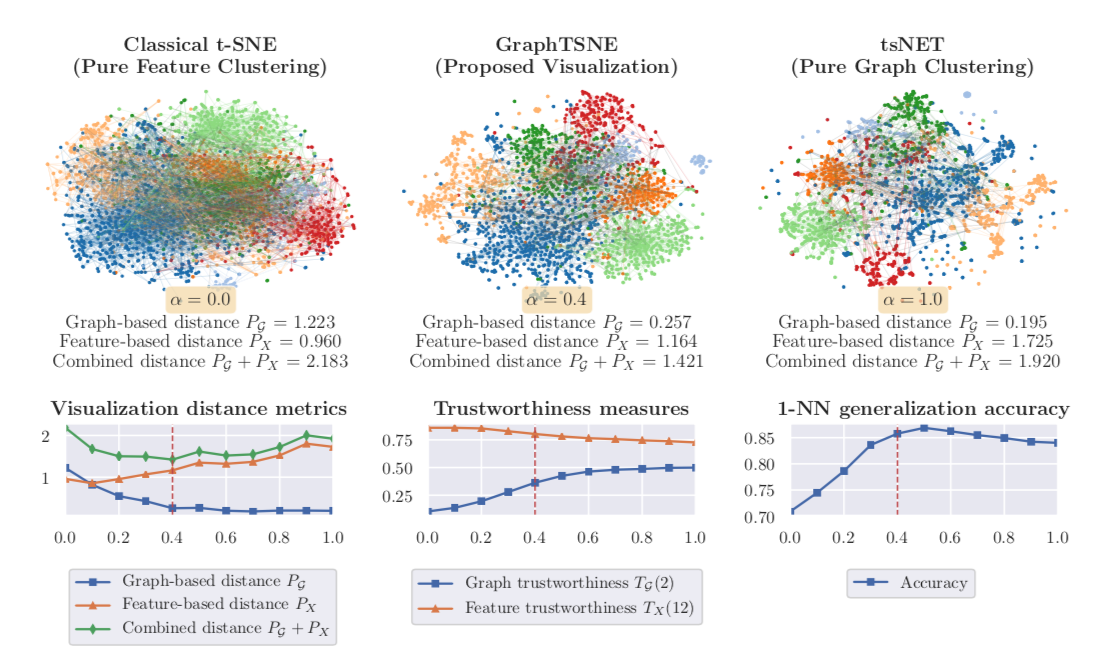 |
|---|
| At the proposed value of , GraphTSNE produces a visualization which reflects the overall graph structure of the data and provides better separation between document classes. |
Conclusion
In this post, we have looked at GraphTSNE as a novel visualization technique for graph-structured data. We believe that this represents an important contribution in the direction of better visualization techniques dedicated to graph machine learning. This is also why we have assembled a suite of evaluation metrics from the literature that will allow for the quantitative assessment of future developments.
Our method is based on scalable and unsupervised training of a graph convolutional network, which is the key mechanism for naturally incorporating information from both graph connectivity and node features. Moving forward, we hope to explore the use of GraphTSNE as an inductive visualization technique that will enable its use on larger and time-evolving datasets.
Code and Paper
If you are interested to use GraphTSNE, check out our code on GitHub. Also, if you use GraphTSNE in your work, we welcome you to cite our ICLR’19 workshop paper:
@inproceedings{leow19GraphTSNE,
  title={GraphTSNE: A Visualization Technique for Graph-Structured Data},
  author={Leow, Yao Yang and Laurent, Thomas and Bresson, Xavier},
  booktitle={
    ICLR Workshop on Representation Learning on Graphs and Manifolds
  },
  year={2019}
}